

1.0
Cite Score 2025
SJR: 0.129 / SNIP: 0.140

JMERC
Owner
Janbazan Medical and Engineering Research Center (JMERC) is the owner of IJWPH.
Volume 18, Issue 1 (2026)
3 2026, 18(1): 1-8 |
Back to browse issues page




History
Received: 2026/11/1 | Accepted: 2026/01/20 | Published: 2026/01/29
Received: 2026/11/1 | Accepted: 2026/01/20 | Published: 2026/01/29
How to cite this article
Dawood S, Nader M. Association of miR-146a Gene Expression with Inflammation of Type 2 Diabetes Mellitus Patients. 3 2026; 18 (1) :1-8
URL: http://ijwph.daneshafarand.org/article-3-85669-en.html
URL: http://ijwph.daneshafarand.org/article-3-85669-en.html
Download citation:
BibTeX | RIS | EndNote | Medlars | ProCite | Reference Manager | RefWorks
Send citation to:


Rights and permissions
BibTeX | RIS | EndNote | Medlars | ProCite | Reference Manager | RefWorks
Send citation to:


1- Al Shahed Mohammed Baqer Alhakim Hospital, Ministry of Health, Baghdad, Iraq
2- Institute of Genetic Engineering and Biotechnology, University of Baghdad, Baghdad, Iraq
2- Institute of Genetic Engineering and Biotechnology, University of Baghdad, Baghdad, Iraq
Full-Text (HTML) (70 Views)
Introduction
Diabetes Mellitus (DM) is a complex chronic condition influenced by both genetic and environmental factors [1]. It represents a significant global public health challenge, imposing a substantial burden worldwide. The World Health Organization (WHO) estimates that diabetes will become the seventh leading cause of death by 2030 [2]. The prevalence of diabetes has been rising in both developed and developing countries [3]. Without effective preventive strategies, the global number of diabetes cases is projected to increase from 451 million in 2017 to 693 million by 2045, according to the International Diabetes Federation (IDF) [4]. In Iraq, the WHO has documented 1.4 million individuals living with diabetes, with type 2 Diabetes Mellitus (T2DM) affecting between 8.5% and 13.9% of the population [5].
Diabetes is mainly characterized by hyperglycemia resulting from either insufficient insulin production, insulin dysfunction, or both [6]. Persistent high blood sugar levels are linked with diabetes and can cause damage or impairment to multiple organs, including the eyes, kidneys, nerves, heart, and blood vessels [7]. Type 1 Diabetes Mellitus (T1DM) arises from autoimmune destruction of pancreatic β-cells, leading to complete insulin deficiency. In contrast, T2DM is characterized by a gradual decline in β-cell insulin secretion, accompanied by insulin resistance [8].
Among these types, T2DM accounts for the majority of cases, approximately 90-95%. Both genetic predisposition and environmental factors influence the development of T2DM. The heritability of complications related to T2DM is estimated at about 40% [9]. Genome-wide association studies have revealed that the pathophysiology and genetic factors underlying T2DM vary across ethnic populations. A person’s genetic makeup is believed to play a significant role in their susceptibility to T2DM [10].
T2DM is an inflammatory metabolic disorder associated with numerous cytokines involved in its development. In addition to contributing to insulin resistance, pro-inflammatory cytokines directly induce β-cell death, which accelerates the progression of T2DM [11]. Interleukins are low-molecular-weight peptides produced by cells such as macrophages, lymphocytes, and monocytes. IL-1β plays a significant role in the development of T2DM by affecting glucose homeostasis. Prolonged exposure to IL-1β can reduce glucose uptake by impairing insulin receptor signaling.
Tumor necrosis factor-alpha (TNF-α) is another cytokine released by chronically inflamed cells. Low-grade chronic pancreatitis is believed to be associated with the development of T2DM [12]. MicroRNAs (miRNAs) are small non-coding regulatory RNA molecules that function by binding to the 3′UTR of their target mRNA(s) and leading to degradation or translational repression [13]. MiR-146a is one of several miRNAs shown to play an important role in the negative regulation of inflammatory innate immune responses and to be differentially expressed in many human diseases, including T2DM [14].
This study aimed to evaluate the expression of miR-146a and pro-inflammatory cytokines (IL-1β and TNF-α) in patients with type 2 diabetes.
Materials and Methods
Design and sampling
This study was conducted from first of January 2025, to the end of June 2025 at the University of Baghdad/Institute of Genetic Engineering and Biotechnology for postgraduate studies. The study included 100 patients (aged 40-70 years) with type 2 diabetes, selected from those who attended Al Shahed Mohammed Baqer Alhakim Hospital. Fifty healthy controls with normal fasting blood glucose (80-110mg/dl) were randomly selected from the people who attend the clinics for checkups, as well as from relatives and colleagues. Exclusion criteria included patients with type 1 diabetes; gestational diabetes; other forms of diabetes; neuropathies from other conditions, such as cervical and lumbar spine diseases, and severe vascular diseases; severe comorbidities like progressive malignant tumors, acute infections, severe renal impairment, or heart failure; and medications affecting platelets (e.g., aspirin) or cardiovascular or hematological diseases that could affect platelet-related indices.
A checklist including age, sex, family history, and BMI for all subjects was used. Both groups were classified according to BMI, age, and gender.
Procedure
All blood samples were drawn under standardized conditions in the morning after overnight fasting, in aseptic conditions, and 5ml of venous blood was collected from each participant. Each sample was then divided into two sections:
- First tube: It was prepared by adding two milliliters of blood to the EDTA tube to be utilized in the HbA1C measuring test.
- Second tube: A clot activator and gel serum separation tubes were filled with the remaining 3 milliliters of venous blood. The blood was allowed to stand at room temperature (20 to 25°C) for 10 to 20 minutes until agglutination occurred. Then, centrifugation at 3000rpm for 15 minutes was performed to obtain serum, which was withdrawn from the separated upper layer. 200μl of serum was added to 600μl of GENezol reagent for gene expression, and the remaining serum was divided into three aliquots in Eppendorf tubes for immunological and biochemical tests.
HbA1c test, Human INS (Insulin)
The HbA1c measurement was performed according to the manufacturer's instructions for the kit-providing company (NYCOCARD™ READER II/NycoCard-Norway). The HOMA-IR was calculated as follows:
HOMA-IR = (Fasting Insulin×Fasting Glucose)/405
ELISA immunological tests for Human IL1b, TNF-α, and Insulin level
The concentrations of IL-1β and TNF-α were measured using ELISA. Each test was estimated separately by following the instructions of the kits provided by the company; TNF-α ELISA Kit (ELK Biotechnology/China), Human IL-1β (Interleukin 1 Beta) ELISA Kit (ELK Biotechnology/China), and Human INS (Insulin) ELISA Kit (Reed biotech/China). The previous kits relied on enzyme-linked immunosorbent assay (ELISA) reagents. About 10% of the serum samples were used for duplicate measurements.
RNA isolation
Total RNA was extracted using the GNEzol reagent (Geneaid, Taiwan) following the manufacturer’s protocol. Briefly, 200μl of serum was thoroughly mixed with 600μl of GNEzol reagent by gently inverting the tube 5-8 times, then incubated at room temperature (RT) for 15 minutes. Subsequently, 200μl of chloroform was added, and the mixture was vigorously shaken. The sample was centrifuged at 12,000×g for 15 minutes at 4°C, and the upper aqueous phase was carefully transferred to a new tube. To this, 400μl of isopropanol was added, and the mixture was incubated at RT for 10 minutes before centrifugation at 12,000×g for 10 minutes at 4°C. The resulting RNA pellet was washed with 75% ethanol, air-dried at RT for 10 minutes, and dissolved in 35 μl of nuclease-free water. RNA concentration and purity were determined using a Nanodrop NAS-99 spectrophotometer (AvansBio, Korea).
Detection of miRNA by qPCR
I. Reaction setup and thermal cycling protocol: Total RNA containing miRNA served as the starting material for the RT-PCR reaction, which was performed in two steps. Due to its short sequence (only~22nt in length), the quantification of miRNAs by qRT-PCR requires extending the length of mature miRNAs using stem-loop or adding poly (A)-tails.
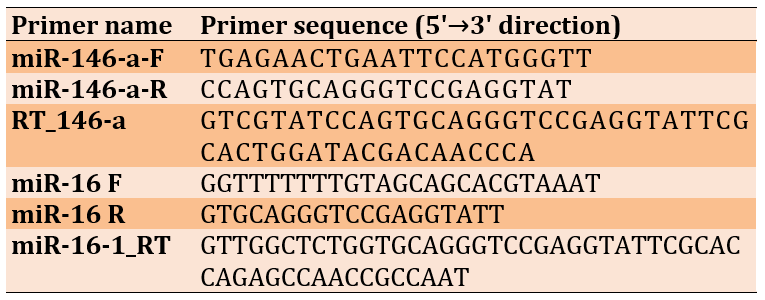
II. Two-Step RT-PCR: miRNA146a and miR16 reference gene expression was done by using specific primers (Table 1).
Table 1. Primer sequence for miRNA gene expression
Step 1: RNA reverse transcription
1- Mix template RNA and primers in a sterile tube.
2. The mixture was incubated at 70°C for 5 minutes and subsequently placed on ice.
3. The incubated primer annealing mixture was transferred to an AccuPower® RT PreMix tube (Bioneer, Korea), and nuclease-free water was added to adjust the total volume to 20μl.
4. Dissolve the vacuum-dried pellet by pipetting or vortexing, then briefly spin down the sample.
5. Carry out the cDNA synthesis reaction under 42°C for 60 minutes, followed by heat inactivation under 95°C for 5 minutes.
6. After the reaction, maintain the reaction mixture at 4°C. The samples can be stored at -20°C until use.
Step 2: Real-time PCR
The gene expression for the miR146-a was estimated separately by the reverse transcription-quantitative polymerase chain reaction (qRT-PCR) method. The method is a very sensitive technique for quantifying steady-state mRNA and miRNA levels. To confirm target gene expression, a quantitative real-time qRT-PCR SYBR Green assay was performed. Specifically designed primers for each gene were utilized in these reactions. The endogenous control gene miR16 levels were amplified and utilized to normalize the miR146-a gene.
Experimental procedures
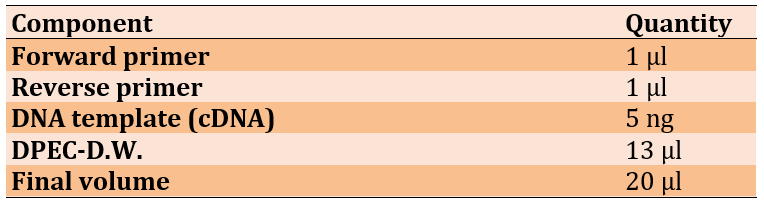
1. Template DNA, primers, and DEPC-D.W. were added into AccuPower® GreenStar™ qPCR PreMix tubes (Bionear/Korea) to make a total volume of 20 μl (Table 2).
Table 2. The components of quantitative real-time PCR were employed in the miR146-a gene expression experiments
2. Seal real-time PCR tubes or plates with adhesive optical sealing film.
3. Dissolve the vacuum-dried pellet by vortexing, and briefly Exispin down.
4. Perform the reaction under the following conditions (Table 3).
Table 3. Real-time PCR program for miRNA gene expression

Relative quantification
The relative quantification of miR was performed by comparing Ct values, using the relative change in the amount of the selected miR in the examined sample relative to the endogenous control and the control sample. First, the ΔCt was calculated by subtracting the selected miR Ct value from the endogenous control’s Ct values. The ΔΔCt was then calculated, which is a subtraction of the average ΔCt of the endogenous control from the individual ΔCt of the selected miR. Finally, a mathematical calculation was performed, in which ΔΔCt values were inserted into the formula to calculate the relative amount of the specific miR (RQ) = 2^(-ΔΔCt).
Statistical analysis
Statistical analyses were performed using GraphPad Prism version [8]. The Shapiro-Wilk test was used to assess the normality of continuous variables. Data are presented as medians and interquartile ranges (IQRs) for non-normally distributed variables. Categorical variables were expressed as frequencies and percentages. Comparisons between diabetic patients and healthy controls were performed using the Mann-Whitney U test for nonparametric continuous variables (e.g., ΔCt, cytokine levels, glycemic indices). The Chi-square test or Fisher’s exact test was used to compare categorical variables where appropriate. To assess miR-146a gene expression, the 2-ΔΔCt method was used with mic16 as the reference gene. Fold change values were log₂-transformed for visualization where applicable. Spearman’s rank correlation coefficient was used to evaluate the association between gene expression levels (miR-146a) and clinical parameters, including cytokine levels (IL-1β and TNF-α), fasting blood sugar (FBS), HbA1c, insulin, and HOMA-IR. Significance was set at p<0.05, and all tests were two-tailed. To study the diagnostic accuracy of selected genes, the Receiver Operating Characteristic (ROC) curve analysis was performed. Area under the ROC curve (AUC) with 95% confidence intervals (CI) was calculated to project the performance or discriminatory ability of every marker at hand. Sensitivity, specificity, positive predictive value (PPV), and negative predictive value (NPV) were reported at optimal cutoff points determined using the Youden index (J=sensitivity+specificity-1). Comparisons between markers were performed using ROC curves and the paired DeLong test, where appropriate. The value of AUC ranges from 0 to 1, and five class classification.
Sample size estimation was guided by power analysis using G*Power software, assuming a medium effect size (Cohen’s d=0.5), alpha=0.05, and power=80%. The final sample of 100 patients and 50 controls was adequate to detect meaningful differences and correlations between inflammatory/glycemic markers.
Findings
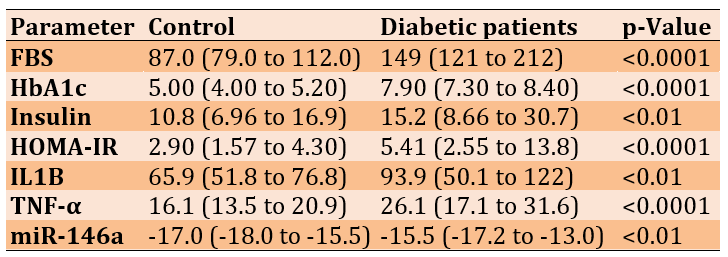
The data were presented as median values with interquartile ranges (IQRs) and minimum and maximum values, and statistical significance was determined using the Mann-Whitney U test for continuous variables and the Chi-square test for discrete variables (Table 4).
Table 4. Comparing the median (pg/ml) of clinical characteristics (Gene expression values were shown as ΔCt; lower ΔCt indicates higher expression) between the control (n=50) and diabetic (n=100) groups by Chi-Square and Mann-Whitney U tests
Comparison of levels of pro-inflammatory cytokine-IL-1β between diabetic patients and healthy controls
Box-and-whisker plots for the two groups were used to show the distribution of IL-1β concentrations.
Patients compared with controls showed significantly higher IL-1β levels (p<0.01; Mann-Whitney U test). Median values are indicated by horizontal lines within boxes; Whiskers represent the full range (Figure 1).
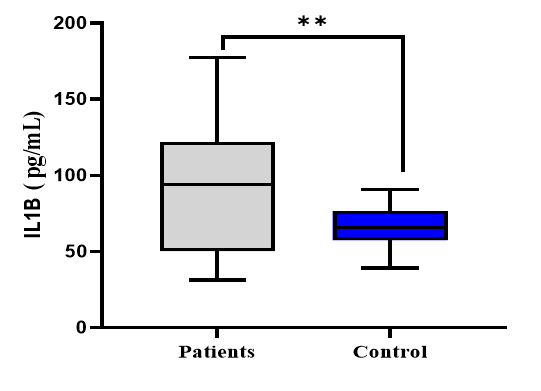
Figure 1. Comparative analysis of IL-1β concentration in cases and controls. Values are displayed as median (IQR). The Mann-Whitney U-test was used for statistical analysis (**p<0.01)
IL-1β receiver operating characteristic curve
Receiver Operating Characteristic (ROC) curve analysis for IL-1β indicated modest discriminatory ability in distinguishing between positive cases (patients) and control cases (negative). The results indicated an area under the ROC curve (AUC) of 0.633 (95% CI=0.545-0.722, p<0.01), suggesting modest discriminatory ability. At the optimal cut-off value of 93.93, IL1B was 51% sensitive and 100% specific, PPV was 93%, and NPV was 50.51%. Overall accuracy was 67.33%, indicating that IL1B is a valuable biomarker under these circumstances (Table 6 and Figure 2).
Table 6. Receiver operating characteristic curve data for IL-1β
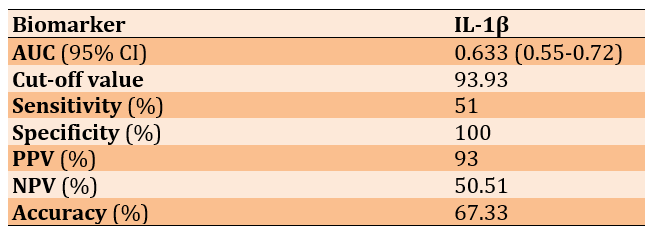
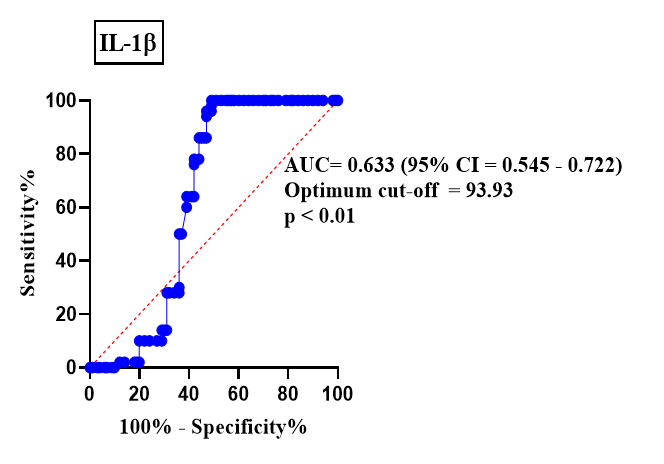
Figure 2. Receiver Operating Characteristic (ROC) plot of IL-1β as a biomarker of diagnosis
Comparison of levels of pro-inflammatory cytokine-TNF-α between diabetic patients and healthy controls
A box-and-whisker plot of the two groups was used to show the distribution of TNF-α concentration.
The levels of TNF-α were significantly elevated (p<0.001) in patients compared with controls (Mann-Whitney U test). The horizontal line within each box represents the median, and the boxes indicate the middle 50% of cases, as illustrated in Figure 3.
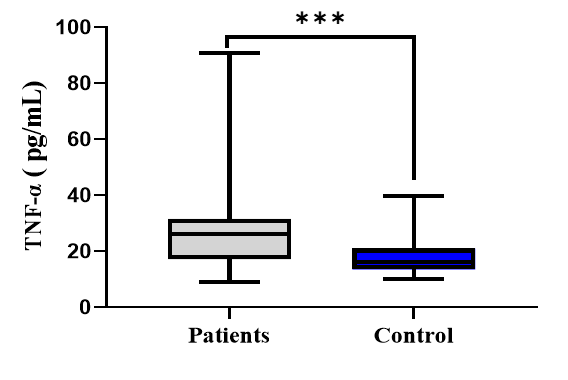
Figure 3. Comparative analysis of TNF-α concentration in cases and controls. Values are displayed as median (IQR). The Mann-Whitney U-test was used for statistical analysis (***p<0.001)
TNF-α receiver operating characteristic curve
Receiver Operating Characteristic (ROC) curve analysis for TNF-α indicated that the discriminatory ability to distinguish between positive cases classified as patients and control cases classified as negative was 0.732 (p<0.0001; Table 7 and Figure 4).
Table 7. Receiver operating characteristic curve data for the TNF-α
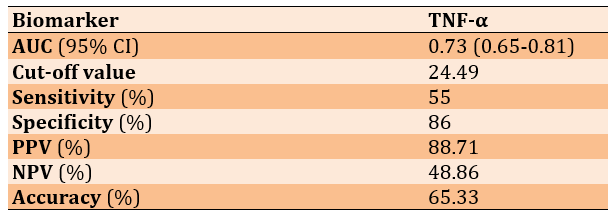
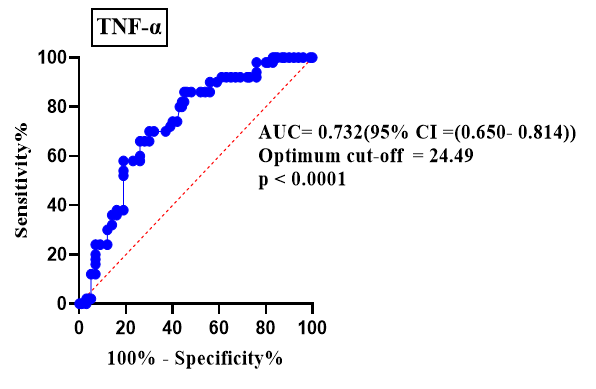
Figure 4. Receiver Operating Characteristic (ROC) plot of TNF-α as a biomarker of diagnosis
Mir-146a gene expression detection by quantitative Real-time PCR
MiR-146a expression levels normalized to mic16 were also compared between diabetic patients and healthy controls using ΔCt values. The median ΔCt value for the patient population was -15.5 and differed significantly from controls at -17 (Figure 5).
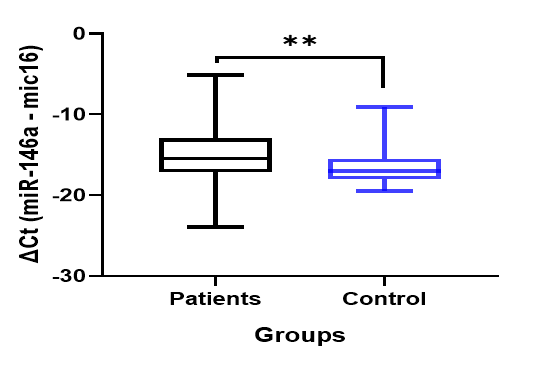
Figure 5. Comparison of miR-146a expression (ΔCt values) between diabetic patients and healthy controls using the Mann-Whitney U test
miR-146a receiver operating characteristic curve
The diagnostic capacity of miR-146a to differentiate patients and controls was measured by ROC curve analysis. ΔCt value for gene was utilized in calculating sensitivity, specificity, predictive values, accuracy, AUC, and corresponding significance. MiR-146a was very discriminatory with an area under the ROC curve (AUC) of 0.9658 (p<0.0001; Table 8 and Figure 6).
Table 8. Receiver operating characteristic curve data for the MiR-146a
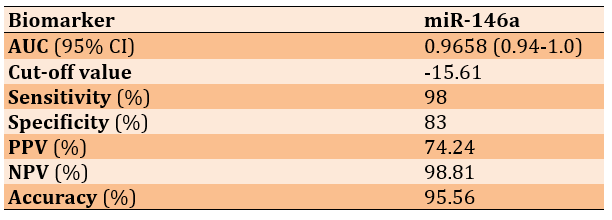
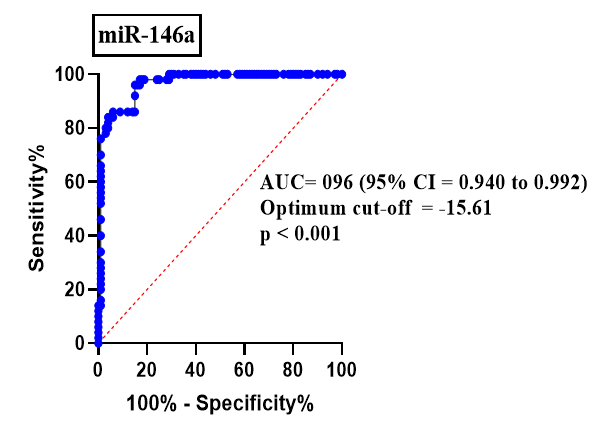
Figure 6. Receiver Operating Characteristic (ROC) plot of miR-146a
The relationship of Mir-146a expressions and inflammatory factors in diabetes patients
The expression of miR146a had a high reverse correlation with IL-1β (rho=-0.65, p<0.0001), and moderate reverse correlation with TNF-α (rho=-0.45, p<0.0001; Figure 7).
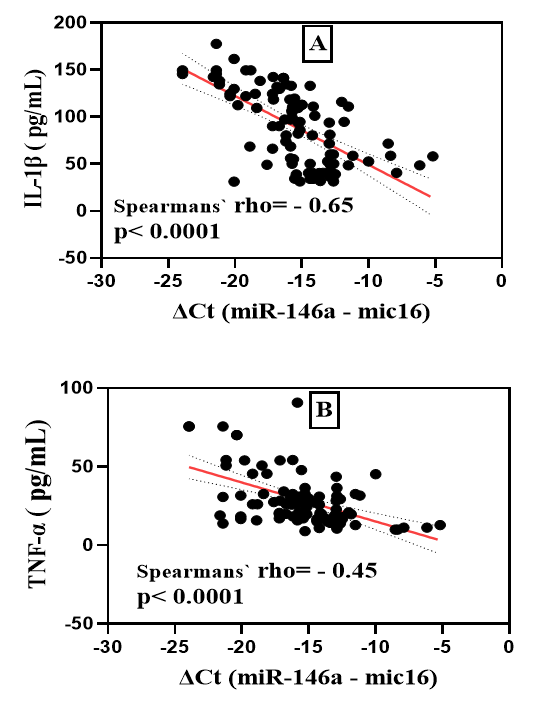
Figure 7. Correlation plots between ΔCt values of miR-146a, gene expression and the levels of inflammatory cytokines IL-1β and TNF-α (pg/mL) in diabetic patients; A) Negative correlation between ΔCt (miR-146a-mic16) and IL-1β (rho=-0.65, p<0.0001); B) Negative correlation between ΔCt (miR-146a-mic16) and TNF-α (rho=-0.45, p<0.0001)
Discussion
The current study was conducted to analyze the clinical, biochemical, and inflammatory profiles of patients with type 2 diabetes mellitus (T2DM) to healthy controls. The results showed marked changes in several indices, indicating metabolic and immune dysfunction in T2DM.
Similar to previous reports, in our study, diabetic patients were significantly higher in fasting blood glucose, HbA1c, fasting insulin, and HOMA-IR index (p<0.01 or p<0.0001). These results are representative of the characteristics of T2DM, such as glucose metabolism disorder, insulin resistance, and dyslipidemia [15].
At the molecular level, decreased miR-146a was found in diabetes patients when compared to controls. These genes play a crucial role in innate immune signaling, in particularly in the context of TLR and IL-1R pathways [16].
Increased serum levels of IL-1β and TNF-α in the diabetic patients. The two cytokines are well-established effector molecules in systemic inflammation and are thought to contribute to dysfunction of the pancreatic β-cell and insulin resistance [17]. The markedly higher levels of IL-1β and TNF-α observed in our study participants suggest that an increased state of pro-inflammatory status occurs that supports the contention that inflammation is pivotal in the pathogenic basis of T2DM.
The current study demonstrated significantly elevated levels of the pro-inflammatory cytokine interleukin-1β (IL-1β) in patients with T2DM compared with healthy controls. This finding aligns with extensive evidence implicating IL-1β as a key mediator in the pathogenesis of T2DM and its complications.
IL-1β is known to contribute to β-cell dysfunction and apoptosis by promoting local inflammation within pancreatic islets. Elevated circulating IL-1β levels also reflect systemic low-grade inflammation, a hallmark of insulin resistance and metabolic syndrome. A number of clinical studies have demonstrated that elevated IL-1β levels are associated with poor glycemic control and less β-cell failure [18].
In addition, IL-1β has been involved in the development of vascular inflammation and atherosclerosis, which may be a part of the enhanced cardiovascular risk in diabetic patients. Therapies directed toward IL-1β, such as IL-1 receptor antagonism, have been promising for glycemic control and reducing inflammation in T2DM [19].
Altogether, it is indicated that the enhanced IL-1β secretion in the current study is in agreement with its function as an essential inflammatory mediator of T2DM and supports the ability to target inflammation in T2DM management.
IL-1β exhibited perfect specificity (100%) at a cut-off of 93.93 pg/mL, but poor sensitivity (51%) and moderate AUC (0.633). These observations reflect the episodic nature of cytokine expression and individual variability in inflammatory responses [20].
The study revealed that T2DM patients had significantly higher serum values of TNF-α as compared to healthy controls. This increase possibly suggested the documented proinflammatory role of TNF-α, which is highly implicated in the insulin resistance and chronic low-grade inflammation characteristic feature of T2DM [21].
TNF-α is associated with insulin resistance due to its ability to block insulin receptor signaling pathways, such as the inhibition of insulin receptor substrate (IRS) phosphorylation, which leads to decreased glucose uptake in peripheral tissues [22]. High levels of circulating TNF-α have been reported in obese and diabetic individuals is directly proportional to the severity of metabolic imbalances [23].
Likewise, TNF-α mediates endothelial dysfunction and also mediates the augmented cardiovascular risk in T2DM by stimulating oxidative stress and vascular inflammation. Therapeutic modalities directed to the TNF-α signaling pathway have proven to be potential therapeutic approaches for ameliorating insulin sensitivity, and TNF-α also adds to the short list of cytokines that may have important molecular targets to manage patients with T2DM [24].
Collectively, the rise in the TNF-α levels in the existing work indicates an important part of it on inflammation associated-metabolic dysregulation in T2DM.
In the current investigation, real-time PCR was performed using SYBR Green, a fluorescent dye that binds to double-stranded DNA, including cDNA. The amplification was documented as a Ct value (cycle threshold). Conversely, a lower Ct value indicates the presence of more target copies, and vice versa. In terms of gene expression, high Ct values imply low expression, whereas low Ct values suggest high expression [25].
This result suggests that miR-146a is downregulated in patients with diabetes compared with healthy controls. Given miR-146a's known role in inflammation control, this downregulation may partly underlie the dysregulated immune responses characteristic of type 2 diabetes. In patients with diabetes, miR-146a showed significantly higher ΔCt values than controls (median ΔCt: -15.5 vs. -17; p < 0.01), indicating downregulation of miR-146a expression in the patient group.
The observed significant downregulation of miR-146a expression in patients with type 2 diabetes mellitus (T2DM), as indicated by higher median ΔCt values than in healthy controls, aligns with emerging evidence implicating miR-146a as a critical regulator of inflammatory processes. MiR-146a is known to function as a negative feedback modulator of the innate immune response, targeting key signaling molecules such as TRAF6 and IRAK1 to suppress excessive pro-inflammatory cytokine production [26].
Reduced expression of miR-146a in T2DM patients may therefore contribute to the chronic low-grade inflammation that underpins the pathogenesis of insulin resistance and β-cell dysfunction [27]. Several studies have reported similar findings, demonstrating decreased circulating or tissue-specific miR-146a levels in diabetic cohorts, which correlate with heightened inflammatory markers and disease severity [28].
Moreover, experimental models indicate that restoration of miR-146a expression can attenuate inflammatory responses and improve insulin sensitivity, highlighting its potential as a therapeutic target [29]. The downregulation detected in this study reinforces the concept that miR-146a dysregulation plays a contributory role in the immune and metabolic disturbances characteristic of T2DM.
The high discriminative power underscores the potential of miR-146a as a robust diagnostic biomarker for T2DM. The negative ΔCt cut-off reflects the higher expression of miR-146a in control subjects, consistent with its proposed role as a negative regulator of inflammation via the NF-κB pathway [30].
The results show that miR-146a expression is significantly inversely correlated with the pro-inflammatory cytokines TNF-α and IL-1β, with a moderate connection with TNF-α (rho=-0.45, p<0.0001) and a greater link with IL-1β (rho=-0.65, p<0.0001). These findings align with the well-established function of miR-146a as a crucial negative regulator of innate immune signalling, namely in the regulation of inflammatory responses mediated by NF-κB [31].
Consistent with earlier research, the present study also showed that diabetic patients had considerably higher blood levels of TNF-α and IL-1β than healthy controls, confirming the existence of persistent low-grade inflammation in type 2 diabetes. These cytokines and miR-146a have been found to be inversely correlated, which implies that decreased miR-146a expression adds to the elevated inflammatory state.
This negative association highlights the potential of miR-146a as a therapeutic target for reducing inflammation associated with diabetes. Improving metabolic control, preventing complications from type 2 diabetes, and regulating immunological activation may all be aided by increasing miR-146a expression [32].
Conclusion
The miRNA-146a expression levels decreased in T2DM individuals. Additionally, a significant relationship between miRNA-146a and inflammatory factors and insulin resistance were observed in this research. MiRNAs may play a crucial role in the pathophysiology of T2DM through inflammatory pathways.
Acknowledgments: The researchers want to thank all the volunteers who agreed to participate in the research.
Ethical Permissions: This research was confirmed by the Ethical Committee of the University of Baghdad (328/20/1/2025).
Conflicts of Interests: The authors declare that they have no conflicts.
Authors' Contribution: Dawood SA (First Author), Methodologist/Main Researcher/Statistical Analyst (60%); Nader MI (Second Author), Introduction Writer/Assistant Researcher/Discussion Writer (40%)
Funding/Support: This research did not receive any specific grant from funding agencies in the public, commercial, or not-for-profit sectors.
Diabetes Mellitus (DM) is a complex chronic condition influenced by both genetic and environmental factors [1]. It represents a significant global public health challenge, imposing a substantial burden worldwide. The World Health Organization (WHO) estimates that diabetes will become the seventh leading cause of death by 2030 [2]. The prevalence of diabetes has been rising in both developed and developing countries [3]. Without effective preventive strategies, the global number of diabetes cases is projected to increase from 451 million in 2017 to 693 million by 2045, according to the International Diabetes Federation (IDF) [4]. In Iraq, the WHO has documented 1.4 million individuals living with diabetes, with type 2 Diabetes Mellitus (T2DM) affecting between 8.5% and 13.9% of the population [5].
Diabetes is mainly characterized by hyperglycemia resulting from either insufficient insulin production, insulin dysfunction, or both [6]. Persistent high blood sugar levels are linked with diabetes and can cause damage or impairment to multiple organs, including the eyes, kidneys, nerves, heart, and blood vessels [7]. Type 1 Diabetes Mellitus (T1DM) arises from autoimmune destruction of pancreatic β-cells, leading to complete insulin deficiency. In contrast, T2DM is characterized by a gradual decline in β-cell insulin secretion, accompanied by insulin resistance [8].
Among these types, T2DM accounts for the majority of cases, approximately 90-95%. Both genetic predisposition and environmental factors influence the development of T2DM. The heritability of complications related to T2DM is estimated at about 40% [9]. Genome-wide association studies have revealed that the pathophysiology and genetic factors underlying T2DM vary across ethnic populations. A person’s genetic makeup is believed to play a significant role in their susceptibility to T2DM [10].
T2DM is an inflammatory metabolic disorder associated with numerous cytokines involved in its development. In addition to contributing to insulin resistance, pro-inflammatory cytokines directly induce β-cell death, which accelerates the progression of T2DM [11]. Interleukins are low-molecular-weight peptides produced by cells such as macrophages, lymphocytes, and monocytes. IL-1β plays a significant role in the development of T2DM by affecting glucose homeostasis. Prolonged exposure to IL-1β can reduce glucose uptake by impairing insulin receptor signaling.
Tumor necrosis factor-alpha (TNF-α) is another cytokine released by chronically inflamed cells. Low-grade chronic pancreatitis is believed to be associated with the development of T2DM [12]. MicroRNAs (miRNAs) are small non-coding regulatory RNA molecules that function by binding to the 3′UTR of their target mRNA(s) and leading to degradation or translational repression [13]. MiR-146a is one of several miRNAs shown to play an important role in the negative regulation of inflammatory innate immune responses and to be differentially expressed in many human diseases, including T2DM [14].
This study aimed to evaluate the expression of miR-146a and pro-inflammatory cytokines (IL-1β and TNF-α) in patients with type 2 diabetes.
Materials and Methods
Design and sampling
This study was conducted from first of January 2025, to the end of June 2025 at the University of Baghdad/Institute of Genetic Engineering and Biotechnology for postgraduate studies. The study included 100 patients (aged 40-70 years) with type 2 diabetes, selected from those who attended Al Shahed Mohammed Baqer Alhakim Hospital. Fifty healthy controls with normal fasting blood glucose (80-110mg/dl) were randomly selected from the people who attend the clinics for checkups, as well as from relatives and colleagues. Exclusion criteria included patients with type 1 diabetes; gestational diabetes; other forms of diabetes; neuropathies from other conditions, such as cervical and lumbar spine diseases, and severe vascular diseases; severe comorbidities like progressive malignant tumors, acute infections, severe renal impairment, or heart failure; and medications affecting platelets (e.g., aspirin) or cardiovascular or hematological diseases that could affect platelet-related indices.
A checklist including age, sex, family history, and BMI for all subjects was used. Both groups were classified according to BMI, age, and gender.
Procedure
All blood samples were drawn under standardized conditions in the morning after overnight fasting, in aseptic conditions, and 5ml of venous blood was collected from each participant. Each sample was then divided into two sections:
- First tube: It was prepared by adding two milliliters of blood to the EDTA tube to be utilized in the HbA1C measuring test.
- Second tube: A clot activator and gel serum separation tubes were filled with the remaining 3 milliliters of venous blood. The blood was allowed to stand at room temperature (20 to 25°C) for 10 to 20 minutes until agglutination occurred. Then, centrifugation at 3000rpm for 15 minutes was performed to obtain serum, which was withdrawn from the separated upper layer. 200μl of serum was added to 600μl of GENezol reagent for gene expression, and the remaining serum was divided into three aliquots in Eppendorf tubes for immunological and biochemical tests.
HbA1c test, Human INS (Insulin)
The HbA1c measurement was performed according to the manufacturer's instructions for the kit-providing company (NYCOCARD™ READER II/NycoCard-Norway). The HOMA-IR was calculated as follows:
HOMA-IR = (Fasting Insulin×Fasting Glucose)/405
ELISA immunological tests for Human IL1b, TNF-α, and Insulin level
The concentrations of IL-1β and TNF-α were measured using ELISA. Each test was estimated separately by following the instructions of the kits provided by the company; TNF-α ELISA Kit (ELK Biotechnology/China), Human IL-1β (Interleukin 1 Beta) ELISA Kit (ELK Biotechnology/China), and Human INS (Insulin) ELISA Kit (Reed biotech/China). The previous kits relied on enzyme-linked immunosorbent assay (ELISA) reagents. About 10% of the serum samples were used for duplicate measurements.
RNA isolation
Total RNA was extracted using the GNEzol reagent (Geneaid, Taiwan) following the manufacturer’s protocol. Briefly, 200μl of serum was thoroughly mixed with 600μl of GNEzol reagent by gently inverting the tube 5-8 times, then incubated at room temperature (RT) for 15 minutes. Subsequently, 200μl of chloroform was added, and the mixture was vigorously shaken. The sample was centrifuged at 12,000×g for 15 minutes at 4°C, and the upper aqueous phase was carefully transferred to a new tube. To this, 400μl of isopropanol was added, and the mixture was incubated at RT for 10 minutes before centrifugation at 12,000×g for 10 minutes at 4°C. The resulting RNA pellet was washed with 75% ethanol, air-dried at RT for 10 minutes, and dissolved in 35 μl of nuclease-free water. RNA concentration and purity were determined using a Nanodrop NAS-99 spectrophotometer (AvansBio, Korea).
Detection of miRNA by qPCR
I. Reaction setup and thermal cycling protocol: Total RNA containing miRNA served as the starting material for the RT-PCR reaction, which was performed in two steps. Due to its short sequence (only~22nt in length), the quantification of miRNAs by qRT-PCR requires extending the length of mature miRNAs using stem-loop or adding poly (A)-tails.
II. Two-Step RT-PCR: miRNA146a and miR16 reference gene expression was done by using specific primers (Table 1).
Table 1. Primer sequence for miRNA gene expression
Step 1: RNA reverse transcription
1- Mix template RNA and primers in a sterile tube.
2. The mixture was incubated at 70°C for 5 minutes and subsequently placed on ice.
3. The incubated primer annealing mixture was transferred to an AccuPower® RT PreMix tube (Bioneer, Korea), and nuclease-free water was added to adjust the total volume to 20μl.
4. Dissolve the vacuum-dried pellet by pipetting or vortexing, then briefly spin down the sample.
5. Carry out the cDNA synthesis reaction under 42°C for 60 minutes, followed by heat inactivation under 95°C for 5 minutes.
6. After the reaction, maintain the reaction mixture at 4°C. The samples can be stored at -20°C until use.
Step 2: Real-time PCR
The gene expression for the miR146-a was estimated separately by the reverse transcription-quantitative polymerase chain reaction (qRT-PCR) method. The method is a very sensitive technique for quantifying steady-state mRNA and miRNA levels. To confirm target gene expression, a quantitative real-time qRT-PCR SYBR Green assay was performed. Specifically designed primers for each gene were utilized in these reactions. The endogenous control gene miR16 levels were amplified and utilized to normalize the miR146-a gene.
Experimental procedures
1. Template DNA, primers, and DEPC-D.W. were added into AccuPower® GreenStar™ qPCR PreMix tubes (Bionear/Korea) to make a total volume of 20 μl (Table 2).
Table 2. The components of quantitative real-time PCR were employed in the miR146-a gene expression experiments
2. Seal real-time PCR tubes or plates with adhesive optical sealing film.
3. Dissolve the vacuum-dried pellet by vortexing, and briefly Exispin down.
4. Perform the reaction under the following conditions (Table 3).
Table 3. Real-time PCR program for miRNA gene expression
Relative quantification
The relative quantification of miR was performed by comparing Ct values, using the relative change in the amount of the selected miR in the examined sample relative to the endogenous control and the control sample. First, the ΔCt was calculated by subtracting the selected miR Ct value from the endogenous control’s Ct values. The ΔΔCt was then calculated, which is a subtraction of the average ΔCt of the endogenous control from the individual ΔCt of the selected miR. Finally, a mathematical calculation was performed, in which ΔΔCt values were inserted into the formula to calculate the relative amount of the specific miR (RQ) = 2^(-ΔΔCt).
Statistical analysis
Statistical analyses were performed using GraphPad Prism version [8]. The Shapiro-Wilk test was used to assess the normality of continuous variables. Data are presented as medians and interquartile ranges (IQRs) for non-normally distributed variables. Categorical variables were expressed as frequencies and percentages. Comparisons between diabetic patients and healthy controls were performed using the Mann-Whitney U test for nonparametric continuous variables (e.g., ΔCt, cytokine levels, glycemic indices). The Chi-square test or Fisher’s exact test was used to compare categorical variables where appropriate. To assess miR-146a gene expression, the 2-ΔΔCt method was used with mic16 as the reference gene. Fold change values were log₂-transformed for visualization where applicable. Spearman’s rank correlation coefficient was used to evaluate the association between gene expression levels (miR-146a) and clinical parameters, including cytokine levels (IL-1β and TNF-α), fasting blood sugar (FBS), HbA1c, insulin, and HOMA-IR. Significance was set at p<0.05, and all tests were two-tailed. To study the diagnostic accuracy of selected genes, the Receiver Operating Characteristic (ROC) curve analysis was performed. Area under the ROC curve (AUC) with 95% confidence intervals (CI) was calculated to project the performance or discriminatory ability of every marker at hand. Sensitivity, specificity, positive predictive value (PPV), and negative predictive value (NPV) were reported at optimal cutoff points determined using the Youden index (J=sensitivity+specificity-1). Comparisons between markers were performed using ROC curves and the paired DeLong test, where appropriate. The value of AUC ranges from 0 to 1, and five class classification.
Sample size estimation was guided by power analysis using G*Power software, assuming a medium effect size (Cohen’s d=0.5), alpha=0.05, and power=80%. The final sample of 100 patients and 50 controls was adequate to detect meaningful differences and correlations between inflammatory/glycemic markers.
Findings
The data were presented as median values with interquartile ranges (IQRs) and minimum and maximum values, and statistical significance was determined using the Mann-Whitney U test for continuous variables and the Chi-square test for discrete variables (Table 4).
Table 4. Comparing the median (pg/ml) of clinical characteristics (Gene expression values were shown as ΔCt; lower ΔCt indicates higher expression) between the control (n=50) and diabetic (n=100) groups by Chi-Square and Mann-Whitney U tests
Comparison of levels of pro-inflammatory cytokine-IL-1β between diabetic patients and healthy controls
Box-and-whisker plots for the two groups were used to show the distribution of IL-1β concentrations.
Patients compared with controls showed significantly higher IL-1β levels (p<0.01; Mann-Whitney U test). Median values are indicated by horizontal lines within boxes; Whiskers represent the full range (Figure 1).
Figure 1. Comparative analysis of IL-1β concentration in cases and controls. Values are displayed as median (IQR). The Mann-Whitney U-test was used for statistical analysis (**p<0.01)
IL-1β receiver operating characteristic curve
Receiver Operating Characteristic (ROC) curve analysis for IL-1β indicated modest discriminatory ability in distinguishing between positive cases (patients) and control cases (negative). The results indicated an area under the ROC curve (AUC) of 0.633 (95% CI=0.545-0.722, p<0.01), suggesting modest discriminatory ability. At the optimal cut-off value of 93.93, IL1B was 51% sensitive and 100% specific, PPV was 93%, and NPV was 50.51%. Overall accuracy was 67.33%, indicating that IL1B is a valuable biomarker under these circumstances (Table 6 and Figure 2).
Table 6. Receiver operating characteristic curve data for IL-1β
Figure 2. Receiver Operating Characteristic (ROC) plot of IL-1β as a biomarker of diagnosis
Comparison of levels of pro-inflammatory cytokine-TNF-α between diabetic patients and healthy controls
A box-and-whisker plot of the two groups was used to show the distribution of TNF-α concentration.
The levels of TNF-α were significantly elevated (p<0.001) in patients compared with controls (Mann-Whitney U test). The horizontal line within each box represents the median, and the boxes indicate the middle 50% of cases, as illustrated in Figure 3.
Figure 3. Comparative analysis of TNF-α concentration in cases and controls. Values are displayed as median (IQR). The Mann-Whitney U-test was used for statistical analysis (***p<0.001)
TNF-α receiver operating characteristic curve
Receiver Operating Characteristic (ROC) curve analysis for TNF-α indicated that the discriminatory ability to distinguish between positive cases classified as patients and control cases classified as negative was 0.732 (p<0.0001; Table 7 and Figure 4).
Table 7. Receiver operating characteristic curve data for the TNF-α
Figure 4. Receiver Operating Characteristic (ROC) plot of TNF-α as a biomarker of diagnosis
Mir-146a gene expression detection by quantitative Real-time PCR
MiR-146a expression levels normalized to mic16 were also compared between diabetic patients and healthy controls using ΔCt values. The median ΔCt value for the patient population was -15.5 and differed significantly from controls at -17 (Figure 5).
Figure 5. Comparison of miR-146a expression (ΔCt values) between diabetic patients and healthy controls using the Mann-Whitney U test
miR-146a receiver operating characteristic curve
The diagnostic capacity of miR-146a to differentiate patients and controls was measured by ROC curve analysis. ΔCt value for gene was utilized in calculating sensitivity, specificity, predictive values, accuracy, AUC, and corresponding significance. MiR-146a was very discriminatory with an area under the ROC curve (AUC) of 0.9658 (p<0.0001; Table 8 and Figure 6).
Table 8. Receiver operating characteristic curve data for the MiR-146a
Figure 6. Receiver Operating Characteristic (ROC) plot of miR-146a
The relationship of Mir-146a expressions and inflammatory factors in diabetes patients
The expression of miR146a had a high reverse correlation with IL-1β (rho=-0.65, p<0.0001), and moderate reverse correlation with TNF-α (rho=-0.45, p<0.0001; Figure 7).
Figure 7. Correlation plots between ΔCt values of miR-146a, gene expression and the levels of inflammatory cytokines IL-1β and TNF-α (pg/mL) in diabetic patients; A) Negative correlation between ΔCt (miR-146a-mic16) and IL-1β (rho=-0.65, p<0.0001); B) Negative correlation between ΔCt (miR-146a-mic16) and TNF-α (rho=-0.45, p<0.0001)
Discussion
The current study was conducted to analyze the clinical, biochemical, and inflammatory profiles of patients with type 2 diabetes mellitus (T2DM) to healthy controls. The results showed marked changes in several indices, indicating metabolic and immune dysfunction in T2DM.
Similar to previous reports, in our study, diabetic patients were significantly higher in fasting blood glucose, HbA1c, fasting insulin, and HOMA-IR index (p<0.01 or p<0.0001). These results are representative of the characteristics of T2DM, such as glucose metabolism disorder, insulin resistance, and dyslipidemia [15].
At the molecular level, decreased miR-146a was found in diabetes patients when compared to controls. These genes play a crucial role in innate immune signaling, in particularly in the context of TLR and IL-1R pathways [16].
Increased serum levels of IL-1β and TNF-α in the diabetic patients. The two cytokines are well-established effector molecules in systemic inflammation and are thought to contribute to dysfunction of the pancreatic β-cell and insulin resistance [17]. The markedly higher levels of IL-1β and TNF-α observed in our study participants suggest that an increased state of pro-inflammatory status occurs that supports the contention that inflammation is pivotal in the pathogenic basis of T2DM.
The current study demonstrated significantly elevated levels of the pro-inflammatory cytokine interleukin-1β (IL-1β) in patients with T2DM compared with healthy controls. This finding aligns with extensive evidence implicating IL-1β as a key mediator in the pathogenesis of T2DM and its complications.
IL-1β is known to contribute to β-cell dysfunction and apoptosis by promoting local inflammation within pancreatic islets. Elevated circulating IL-1β levels also reflect systemic low-grade inflammation, a hallmark of insulin resistance and metabolic syndrome. A number of clinical studies have demonstrated that elevated IL-1β levels are associated with poor glycemic control and less β-cell failure [18].
In addition, IL-1β has been involved in the development of vascular inflammation and atherosclerosis, which may be a part of the enhanced cardiovascular risk in diabetic patients. Therapies directed toward IL-1β, such as IL-1 receptor antagonism, have been promising for glycemic control and reducing inflammation in T2DM [19].
Altogether, it is indicated that the enhanced IL-1β secretion in the current study is in agreement with its function as an essential inflammatory mediator of T2DM and supports the ability to target inflammation in T2DM management.
IL-1β exhibited perfect specificity (100%) at a cut-off of 93.93 pg/mL, but poor sensitivity (51%) and moderate AUC (0.633). These observations reflect the episodic nature of cytokine expression and individual variability in inflammatory responses [20].
The study revealed that T2DM patients had significantly higher serum values of TNF-α as compared to healthy controls. This increase possibly suggested the documented proinflammatory role of TNF-α, which is highly implicated in the insulin resistance and chronic low-grade inflammation characteristic feature of T2DM [21].
TNF-α is associated with insulin resistance due to its ability to block insulin receptor signaling pathways, such as the inhibition of insulin receptor substrate (IRS) phosphorylation, which leads to decreased glucose uptake in peripheral tissues [22]. High levels of circulating TNF-α have been reported in obese and diabetic individuals is directly proportional to the severity of metabolic imbalances [23].
Likewise, TNF-α mediates endothelial dysfunction and also mediates the augmented cardiovascular risk in T2DM by stimulating oxidative stress and vascular inflammation. Therapeutic modalities directed to the TNF-α signaling pathway have proven to be potential therapeutic approaches for ameliorating insulin sensitivity, and TNF-α also adds to the short list of cytokines that may have important molecular targets to manage patients with T2DM [24].
Collectively, the rise in the TNF-α levels in the existing work indicates an important part of it on inflammation associated-metabolic dysregulation in T2DM.
In the current investigation, real-time PCR was performed using SYBR Green, a fluorescent dye that binds to double-stranded DNA, including cDNA. The amplification was documented as a Ct value (cycle threshold). Conversely, a lower Ct value indicates the presence of more target copies, and vice versa. In terms of gene expression, high Ct values imply low expression, whereas low Ct values suggest high expression [25].
This result suggests that miR-146a is downregulated in patients with diabetes compared with healthy controls. Given miR-146a's known role in inflammation control, this downregulation may partly underlie the dysregulated immune responses characteristic of type 2 diabetes. In patients with diabetes, miR-146a showed significantly higher ΔCt values than controls (median ΔCt: -15.5 vs. -17; p < 0.01), indicating downregulation of miR-146a expression in the patient group.
The observed significant downregulation of miR-146a expression in patients with type 2 diabetes mellitus (T2DM), as indicated by higher median ΔCt values than in healthy controls, aligns with emerging evidence implicating miR-146a as a critical regulator of inflammatory processes. MiR-146a is known to function as a negative feedback modulator of the innate immune response, targeting key signaling molecules such as TRAF6 and IRAK1 to suppress excessive pro-inflammatory cytokine production [26].
Reduced expression of miR-146a in T2DM patients may therefore contribute to the chronic low-grade inflammation that underpins the pathogenesis of insulin resistance and β-cell dysfunction [27]. Several studies have reported similar findings, demonstrating decreased circulating or tissue-specific miR-146a levels in diabetic cohorts, which correlate with heightened inflammatory markers and disease severity [28].
Moreover, experimental models indicate that restoration of miR-146a expression can attenuate inflammatory responses and improve insulin sensitivity, highlighting its potential as a therapeutic target [29]. The downregulation detected in this study reinforces the concept that miR-146a dysregulation plays a contributory role in the immune and metabolic disturbances characteristic of T2DM.
The high discriminative power underscores the potential of miR-146a as a robust diagnostic biomarker for T2DM. The negative ΔCt cut-off reflects the higher expression of miR-146a in control subjects, consistent with its proposed role as a negative regulator of inflammation via the NF-κB pathway [30].
The results show that miR-146a expression is significantly inversely correlated with the pro-inflammatory cytokines TNF-α and IL-1β, with a moderate connection with TNF-α (rho=-0.45, p<0.0001) and a greater link with IL-1β (rho=-0.65, p<0.0001). These findings align with the well-established function of miR-146a as a crucial negative regulator of innate immune signalling, namely in the regulation of inflammatory responses mediated by NF-κB [31].
Consistent with earlier research, the present study also showed that diabetic patients had considerably higher blood levels of TNF-α and IL-1β than healthy controls, confirming the existence of persistent low-grade inflammation in type 2 diabetes. These cytokines and miR-146a have been found to be inversely correlated, which implies that decreased miR-146a expression adds to the elevated inflammatory state.
This negative association highlights the potential of miR-146a as a therapeutic target for reducing inflammation associated with diabetes. Improving metabolic control, preventing complications from type 2 diabetes, and regulating immunological activation may all be aided by increasing miR-146a expression [32].
Conclusion
The miRNA-146a expression levels decreased in T2DM individuals. Additionally, a significant relationship between miRNA-146a and inflammatory factors and insulin resistance were observed in this research. MiRNAs may play a crucial role in the pathophysiology of T2DM through inflammatory pathways.
Acknowledgments: The researchers want to thank all the volunteers who agreed to participate in the research.
Ethical Permissions: This research was confirmed by the Ethical Committee of the University of Baghdad (328/20/1/2025).
Conflicts of Interests: The authors declare that they have no conflicts.
Authors' Contribution: Dawood SA (First Author), Methodologist/Main Researcher/Statistical Analyst (60%); Nader MI (Second Author), Introduction Writer/Assistant Researcher/Discussion Writer (40%)
Funding/Support: This research did not receive any specific grant from funding agencies in the public, commercial, or not-for-profit sectors.
Keywords:
References
1. Ridha R, Kandala N. Association of genetic polymorphisms in a sample of Iraqi patients with type 2 diabetes mellitus. Iraqi J Biotechnol. 2016;15(3). [Link]
2. Alam S, Hasan MK, Neaz S, Hussain N, Hossain MF, Rahman T. Diabetes mellitus: Insights from epidemiology, biochemistry, risk factors, diagnosis, complications, and comprehensive management. Diabetology. 2021;2(2):36-50. [Link] [DOI:10.3390/diabetology2020004]
3. Patterson C, Harjutsalo V, Rosenbauer J, Neu A, Cinek O, Skrivarhaug T, et al. Trends and cyclical variation in the incidence of childhood type 1 diabetes in 26 European centers in the 25 year period 1989-2013: A multicenter prospective registration study. Diabetologia. 2019;62(3):408-17. [Link] [DOI:10.1007/s00125-018-4763-3]
4. Cho NH, Shaw JE, Karuranga S, Huang Y, Da Rocha Fernandes JD, Ohlrogge AW, et al. IDF diabetes atlas: Global estimates of diabetes prevalence for 2017 and projections for 2045. Diabetes Res Clin Pract. 2018;138:271-81. [Link] [DOI:10.1016/j.diabres.2018.02.023]
5. Lateef A, Mohammed B. Effect of age on apoptosis and necrosis of peripheral blood lymphocytes in sample of Iraqi type 2 diabetes patients. Iraqi J Biotechnol. 2023;22(1). [Link]
6. Al-Ayash M, Nader M. Long non-coding RNA-H19 and miRNA-29a expression in type 2 diabetes mellitus patients. Romanian J Diabetes Nutr Metab Dis. 2025;32(3):253-61. [Link]
7. Jwad M, Gharbi W. Determination of IFN-y in patients with pseudomonas aeruginosa-inflicted burn and wound. REVISTA BIONATURA. 2022;7(4):2. [Link] [DOI:10.21931/RB/2022.07.04.2]
8. Mudhaffer N, Hassan IA. Expression and polymorphisms of the IRS1 gene as related with the risk of type 2 diabetes mellitus in Iraqi patients. Int J Endocrinol. 2025;21(7):708-12. [Link] [DOI:10.22141/2224-0721.21.7.2025.1636]
9. Shojima N, Yamauchi T. Progress in genetics of type 2 diabetes and diabetic complications. J Diabetes Investig. 2023;14(4):503-15. [Link] [DOI:10.1111/jdi.13970]
10. ElSayed NA, Aleppo G, Aroda VR, Bannuru RR, Brown FM, Bruemmer D, et al. 2. Classification and diagnosis of diabetes: Standards of care in diabetes-2023. Diabetes Care. 2023;46(Suppl 1):S19-40. [Link] [DOI:10.2337/dc23-S002]
11. Abdel-Moneim A, Abd El-Twab SM, Nabil A, El Kazafy SA. Effect of antidiabetic therapy on TNF-α, IL-18, IL-23 and IL-35 levels in T2DM patients with coincidental Helicobacter pylori infection. J Taibah Univ Sci. 2020;14(1):1377-85. [Link] [DOI:10.1080/16583655.2020.1824669]
12. Tian J, Zhao Y, Wang L, Li L. Role of TLR4/ MyD88/ NF-κB signaling in heart and liver-related complications in a rat model of type 2 diabetes mellitus. J Int Med Res. 2021;49(3):300060521997590. [Link] [DOI:10.1177/0300060521997590]
13. Sahan K, Aziz I, Dawood S, Razzaq S. Evaluation of miR-146 and miR-196 as potential biomarkers in a sample of Iraqi breast cancer patients. REVISTA BIONATURA. 2023;8(2):1-10. [Link] [DOI:10.21931/RB/CSS/2023.08.02.8]
14. Benko J, Sarlinova M, Mikusova V, Bolek T, Pec MJ, Halasova E, et al. MiR-126 and miR-146a as markers of type 2 diabetes mellitus: A pilot study. Bratisl Lek Listy. 2023;124(7):527-33. [Link] [DOI:10.4149/BLL_2023_081]
15. Haneen AA, Essam FJ. The relationship between some biochemical parameters and type 2 diabetes mellitus among Iraqi patients. Iraqi J Biotechnol. 2022;21(2). [Link]
16. Elimam H, Abdulla A, Taha I. Inflammatory markers and control of type 2 diabetes mellitus. Diabetes Metab Syndr. 2019;13(1):800-4. [Link] [DOI:10.1016/j.dsx.2018.11.061]
17. Donath MY, Shoelson SE. Type 2 diabetes as an inflammatory disease. Nat Rev Immunol. 2011;11(2):98-107. [Link] [DOI:10.1038/nri2925]
18. Ying W, Fu W, Lee YS, Olefsky JM. The role of macrophages in obesity-associated islet inflammation and β-cell abnormalities. Nat Rev Endocrinol. 2020;16(2):81-90. [Link] [DOI:10.1038/s41574-019-0286-3]
19. Peiró C, Lorenzo Ó, Carraro R, Sánchez-Ferrer CF. IL-1β inhibition in cardiovascular complications associated to diabetes mellitus. Front Pharmacol. 2017;8:363. [Link] [DOI:10.3389/fphar.2017.00363]
20. Acharya AB. Evaluation of systemic cytokines IL-1β, IL-4, IL-6, IL-10 and TNF-α in health, chronic periodontitis and type 2 diabetes mellitus [dissertation]. Bengaluru: Rajiv Gandhi University of Health Sciences; 2016. [Link] [DOI:10.15406/jdhodt.2017.06.00188]
21. Younus A, Al-Faisal A. Correlation of toll-like receptor 4 and tumour necrosis factor Alfa with type-2 diabetes mellitus. J Eng Sci Technol. 2024;19(3):880-93. [Link] [DOI:10.1016/j.jtumed.2024.04.005]
22. Berbudi A, Khairani S, Tjahjadi AI. Interplay between insulin resistance and immune dysregulation in type 2 diabetes mellitus: Implications for therapeutic interventions. Immunotargets Ther. 2025;14:359-82. [Link] [DOI:10.2147/ITT.S499605]
23. Akash M, Rehman K, Liaqat A. Tumor necrosis factor‐alpha: Role in development of insulin resistance and pathogenesis of type 2 diabetes mellitus. J Cell Biochem. 2018;119(1):105-10. [Link] [DOI:10.1002/jcb.26174]
24. Pucelik B, Barzowska A, Dąbrowski JM, Czarna A. Diabetic Kinome inhibitors-a new opportunity for β-Cells restoration. Int J Mol Sci. 2021;22(16):9083. [Link] [DOI:10.3390/ijms22169083]
25. Al-Kinani HJA. Genotype analysis of hepatocyte nuclear factor 1A gene and miRNA-122 5p expression in patients with maturity-onset diabetes of the young type 3 (MODY3) in Baghdad province [dissertation]. Baghdad: University of Baghdad; 2023. [Link]
26. Al-Saffar E, AL-Saadi B, Awadh N. Study the association of miRNA-146a gene polymorphism and some immunological markers with the risk of Rheumatoid Arthritis incidence in a sample of Iraqi patients. REVISTA BIONATURA. 2023;8(2):1-14. [Link] [DOI:10.21931/RB/CSS/2023.08.02.22]
27. Liu S, Da Cunha AP, Rezende RM, Cialic R, Wei Z, Bry L, et al. The host shapes the gut microbiota via fecal MicroRNA. Cell Host Microbe. 2016;19(1):32-43. [Link] [DOI:10.1016/j.chom.2015.12.005]
28. Ghaffari M, Razi S, Zalpoor H, Nabi-Afjadi M, Mohebichamkhorami F, Zali H. Association of MicroRNA-146a with type 1 and 2 diabetes and their related complications. J Diabetes Res. 2023;2023:2587104. [Link] [DOI:10.1155/2023/2587104]
29. Sanada T, Sano T, Sotomaru Y, Alshargabi R, Yamawaki Y, Yamashita A, et al. Anti-inflammatory effects of miRNA-146a induced in adipose and periodontal tissues. Biochem Biophys Rep. 2020;22:100757. [Link] [DOI:10.1016/j.bbrep.2020.100757]
30. Sabio G, Davis RJ. cJun NH2-terminal kinase 1 (JNK1): Roles in metabolic regulation of insulin resistance. Trends Biochem Sci. 2010;35(9):490-6. [Link] [DOI:10.1016/j.tibs.2010.04.004]
31. Naidu C, Cox A, Lewohl J. Influence of sex and liver cirrhosis on the expression of miR-146a-5p and its target genes, IRAK1 and TRAF6. Brain Res. 2024;1827:148763. [Link] [DOI:10.1016/j.brainres.2024.148763]
32. Zhou H, Ni W, Meng X, Tang L. MicroRNAs as regulators of immune and inflammatory responses: Potential therapeutic targets in diabetic nephropathy. Front Cell Dev Biol. 2021;8:618536. [Link] [DOI:10.3389/fcell.2020.618536]